
Occupied housing units in EV reaches 975,625
By PSA-8
June 6, 2018
TACLOBAN CITY – Results of the 2015 Census of Population (POPCEN) showed that Eastern Visayas had a total occupied housing units of 975,625 as of August 1, 2015. This is an increase of 13.6% or 116,910 housing units over the 858,715 occupied housing units recorded during the 2010 Census of Population and Housing (CPH). This figure resulted to a ratio of 101 households for every 100 occupied housing units or 5 persons per occupied housing unit.
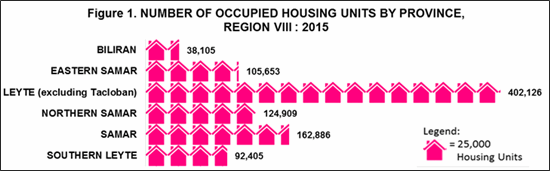
Leyte (excluding Tacloban City) recorded the highest number of occupied housing units among the provinces with 402,126 housing units or 41.2% of the total housing units in the region. Samar ranked second with 162,886 occupied housing units, followed by Northern Samar with 124,909, Eastern Samar with 105,653 and Southern Leyte with 92,405. Biliran recorded the least number of occupied housing units posted at 38,105 (Figure 1).
Tacloban City, the lone Highly Urbanized City (HUC) in the region, recorded a total of 49,541 occupied housing units.
Single-type house was the most common type of building/house in Eastern Visayas. Ninety-four percent of the total occupied housing unit in Eastern Visayas reported this type of building/house. About 4.1% were duplex while 1.7% were multi-unit residential.
Majority or 77.2% of the occupied housing units in the region had roofs made of galvanized iron/aluminum. Meanwhile, about three in ten (30.7%) of the occupied housing units in the region in 2015 had outer walls made of concrete/brick/stone.
Of the total 985,418 households in 2015, almost half (46.6%) owned or amortized the house and lots that they occupied in 2015. A little over one-third (38.2%) of the households occupied houses which they owned but not the lots, they were rent-free with consent of the owner; 6.5% owned the houses but rented the lots that they occupied; 4.8% lived in rent-free house and lots with consent of the owner; 2.3% lived in rented house and lot; 1.5% lived in own house and rent-free lot without consent of the owner; and 0.2% lived in rent-free house and lot without consent of the owner.
Majority or 83.9% of the 985,418 households in the region used electricity for lighting. Households that used kerosene for lighting accounted for 13.0. Solar lamps were used by about 1.6 percent of the households.
Of the total 985,418 households in 2015, 31.5% used shared faucet community water system as main source of drinking water. The second highest reported source of drinking water was own use faucet community water system which accounted for 18.2% of the total households. The rest of the households used the following sources: shared tubed/piped deep well (16.2%); bottled water (13.5%); dug well (5.7%); protected spring (5.0%); own use tubed/piped deep well (3.0%); tubed/piped shallow well (2.7%); peddler (2.0%); unprotected spring (1.4%); lake, river, rain (0.8%); and others (0.1%).
One-third or 33.1% of the households used shared faucet community water system as main source of water for cooking. The second highest reported source of water for cooking was own use faucet community water system which accounted for a quarter or 25.4% of the total households. The rest of the households used the following sources: shared tubed/piped deep well (17.9%); dug well (7.2%); own use tubed/piped deep well (4.5%); protected spring (4.4%); tubed/piped shallow well (3.2%); unprotected spring (1.3%); peddler (1.1%); bottled water (0.9%); and lake, river, rain (0.9%).